Digital Enterprise Journal (DEJ) surveyed more than 2,300 organizations to quantify the correlation between the value proposition of IT performance solutions and business areas such as: 1) creating competitive advantage; 2) return on investment (ROI); 3) cost of not acting; and 4) impact on business outcomes. The findings of this research are summarized in a study that is recently published and is titled – “The Total Business Impact of IT Performance”.
The study revealed that there are many segments of IT performance that impact the business (some more and some less), but when added all together the impact is enormous. This Research Note highlights some of the areas that are having the strongest impact on business metrics, as well as the technology capabilities that are the most effective in addressing key challenges.
The monetary numbers below are calculated based on an average company size of 1,238 employees.
$14.37 million – Average annual cost due to lack of capabilities for user management (customer, employee, user experience, etc.)
The emergence of remote and hybrid work models combined with increasing expectations for creating and managing user experiences that can be a source of competitive advantage are generating a perfect storm of new requirements for user management. Sixty-seven percent of organizations that participated in this study reported a lack of visibility into usage of transformational technologies as one of the key challenges. Additionally, 65% of organizations do not have capabilities for measuring user productivity. These challenges are having a major impact on business results that leads to over $14 million in average annual loss.
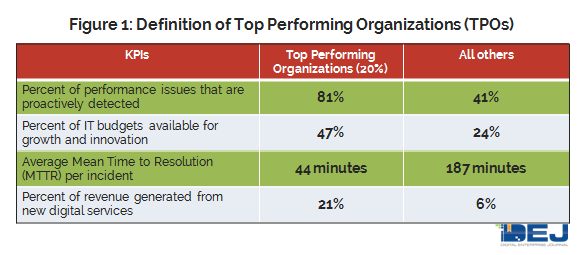
The study shows that Top Performing Organizations (TPOs – top 20% of the survey based on their performance – see Figure 1) are reporting, on average, 20 points higher customer satisfaction score by TPOs, as compared to all others. Some of the capabilities that these leading organizations are deploying are provided by vendors such as: 1E (experience and engagement analytics, asset management, endpoint management, etc.), Aternity, eG Innovations (End-to-end visibility into user experience and application performance), Login VSI (user experience management solutions for automatically testing the impact of change by using synthetic agents) and Nexthink (platform for digital employee experience management (DEX) with strong analytics capabilities, proactive management and full visibility into workforce productivity and the quality of user experience).
$21.58 million – Average annual cost of not acting for managing cloud performance
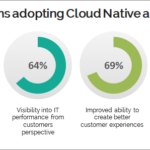
DEJ’s research shows that managing cloud performance is becoming increasingly critical and it has a major impact on each aspect of the business. DEJ’s Research Note, “20 Areas Defining IT Performance Management in 2021” shows that driving innovation surpassed cost savings as the top driver for deploying cloud services. Additionally, DEJ’s upcoming research on Enabling the Cloud Native Journey shows that adopting this approach leads to significant business benefits.
However, 48% of organizations in the study reported cloud transformation and migration management as one of their key challenges. Effective management of cloud performance requires a strategic approach that includes the right mix of technology capabilities and, more importantly, an awareness that solutions and strategies that were designed for more traditional environments are not as effective when deployed for cloud management.
The research shows that TPOs are 4.2 times more likely to create a competitive advantage from using cloud services, as compared to all others. Some of the capabilities that these leading organizations are deploying are provided by vendors such as: Chronosphere, Coralogix, Datadog, Dynatrace, Micro Focus, OpsRamp, Riverbed, ScienceLogic, Splunk, VMware and Zenoss.
$4.218 million – Average revenue loss due to lack of capabilities for managing remote work
Forty-six percent of organizations in the study reported enabling remote work as their top business goal for the next 12 months. However, the majority of organizations are struggling with achieving this objective, as 73% reported a lack of visibility into user experience for remote workers as one of their key challenges. Additionally, 57% of organizations are reporting a lack of alignment across teams and businesses as the key issue around managing remote work.
The study shows that TPOs are spending 41% less in labor IT cost for managing user experience for remote workers, as compared to all others. Some of the capabilities that these top performing organizations are deploying are provided by vendors such as: 1E (Unified Experience Management platform), BigPanda, Jellyfish (engineering management platform enabling an alignment of engineering work and business goals), Nexthink, PagerDuty and Riverbed.
$36,34 million – Average annual loss due to the inability to proactively prevent performance issues
DEJ’s study, “19 Key Areas Shaping IT Performance Markets in 2020” revealed that the inability to identify performance problems before users are impacted is the #1 challenge for managing IT performance (64% of organizations). Taking a proactive approach to managing performance of digital services has had a strong impact on each of the key 8 business outcomes (see chart below)). Adopting this approach goes beyond deploying technology capabilities and it should be a part of organizational strategy and a people-centric IT culture. Also, in order to mitigate an enormous cost of not acting around preventing performance issues, organizations should be applying a proactive approach throughout the entire digital service delivery value chain (from early pre-production to an interaction with a user).
The study shows that TPOs are spending nearly two times less on maintaining existing services and their success rate in preventing performance issues is nearly two times higher, as compared to all others. Some of the capabilities that these leading organizations are deploying are provided by vendors such as: BigPanda, Chronosphere, Gremlin, Nexthink, ScienceLogic, Splunk, StormForge (provides a ML-based technology that includes a combination of capabilities for Kubernetes performance testing and application optimization) and VMware.
$4,62 million – Average annual cost of “war room” meetings
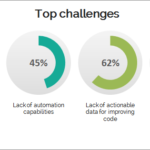
The study shows that organizations are spending too much time and resources on maintaining existing services and “keeping the lights” on, which reduces their ability to use technology for business growth. Seventy-two percent of organizations reported time and resources spent on resolving performance issues as one of their key challenges. This comes as a result of issues that organizations are experiencing in a number of areas: lack of actionable context for monitoring data (62% of organizations), time spent on identifying the root cause (62%), inability to correlate data from different domains (59%), inefficient process for analyzing log data (52%) and scalability of management solutions (48%).
The study shows that TPOs are reporting a 2.7 times shorter average duration of a war room meeting, as compared to all others. Some of the capabilities that these leading organizations are deploying are provided by vendors such as: BigPanda, Blameless, FireHydrant, Moogsoft, Netreo, PagerDuty, Riverbed, ScienceLogic, Splunk, Transposit and Zenoss.
$3,355 million – Average annual revenue loss due to Engineers not focusing on business critical tasks
This study shows that 68% of organizations do not have visibility into how resources are being used. Also, DEJ’s study on “Enabling Top Performing Engineering Teams” revealed that an inability to prioritize engineering resources is one of the top challenges for 61% of organizations. Also, DEJ’s study on IT Transformation reveals a 3.4 times increase in missed revenue due to slow software delivery since 2018.
Streamlining business processes for managing IT is increasingly impacting business results and organizations should be looking to deploy capabilities that range from context-based automation, platforms for enabling SREs to aligning engineering work with business priorities.
The study reveals that TPOs are spending 33% less time on unplanned work, as compared to all others. Some of the capabilities that these top performing organizations are deploying are provided by vendors such as: Blameless, Jellyfish, Lightstep, PagerDuty, Rookout and Transposit.
$7,171 million – Average annual cost and revenue loss due to a lack of observability
DEJ’s research shows that a number of organizations that are using technology as the key enabler for achieving top business goals increased 2.4 times over the last two years. New technologies are changing the performance management game and a lack of capabilities for managing these environments is having a major business impact. However, 61% of organizations reported that their visibility into performance of IT services declined since conducting the modernizing of their infrastructure.
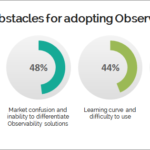
DEJ’s recent study shows that the value proposition of Observability hits all of the key challenges they are experiencing, from the inability to proactively prevent performance issues (64% of organizations) and lack of actionable context for IT performance data, to keeping up with the amount of change in IT environments (54%) and the volume and velocity of data to be processed (51%). However, some organizations are still struggling with adopting this concept and the figure below shows some of their key issues. The financial loss due to a lack of visibility is way too significant and organizations should put an effort into identifying technology vendors that would help them overcome these obstacles.
The study reveals that TPOs are 82% more likely to be deploying Observability capabilities and, as a result, are experiencing a 68% higher return on investment from transformational enterprise technologies, as compared to all others. Some of the capabilities that these top performing organizations are deploying are provided by vendors such as: AppDynamics (part of Cisco), Coralogix, Chronosphere, Dynatrace, Elastic, Era Software, Instana (part of IBM), Kentik, Lightstep, Moogsoft, ScienceLogic, StackState, Splunk and VMware.
$2,465 million – Average annual cost due to ineffectiveness in managing microservices
Forty-four percent of organizations in DEJ’s upcoming study on Kubernetes management reported that existing IT infrastructures are not a good fit for creating business value. Additionally, 61% of these organizations are finding that legacy management tools are not effective for managing the performance of microservices. As organizations are increasingly deploying microservices, they are running into a number of challenges that are ranging from acquiring and retaining the right talent, lack of automation and capabilities for testing and optimizing application performance, scalability and cost issues to fragmented data and time to value of management solutions. DEJ’s research shows that focusing on addressing these issues is well worth it, as the effective management of microservices impacts all of the key business goals.
The research shows that TPOs are reporting a 2.7 times faster time from code completed to production, as compared to all others. Some of the capabilities that these leading organizations are deploying are provided by vendors such: Chronosphere, Dynatrace, Instana (part of IBM), Kong, Rafay Systems, Splunk, StormForge and VMware.
$16,63 million – Average annual cost and revenue loss due to inefficiencies in launching new digital services
As time to the market is becoming increasingly important, organizations are finding it more and more challenging to find the right balance between speed of delivery and reliability of digital services. In order to achieve this goal, organizations need to enhance their data management, automation, collaboration and visibility capabilities. More importantly, organizations ought to create holistic strategies that should include implementing culture and processes that are aligned with using technology as a source of competitive advantage.
The study shows that TPOs are 3.2 times more likely to create new revenue streams from technology deployments. Some of the capabilities that these leading organizations are deploying are providing vendors such as: Blameless, ConnectALL (Value Stream Management solution), Dynatrace, Jellyfish, Pliant (platform for automating and orchestrating deployments of new services), PagerDuty, Rookout (providing actionable insights that allow organizations to improve software code), Splunk and StackState.
Summary
This study shows that deployments of the right IT performance management capabilities is a difference maker for each aspect of the business. However, not all IT performance management solutions are created equal. Therefore, organizations should rethink their evaluation processes for technology purchases and ensure that the solutions they select have the strongest impact on the business.
The Study can be accessed on DEJ’s website through this link. The complementary version can be downloaded on the websites of vendors that own distribution rights to the study: Micro Focus, Nexthink and OpsRamp.


