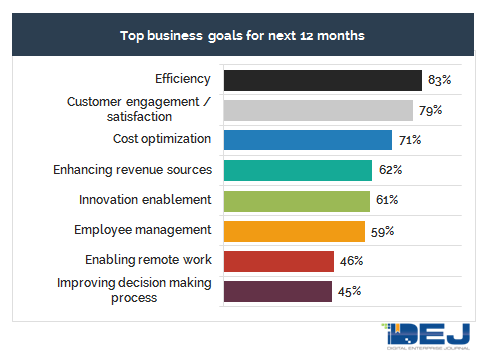
Digital Enterprise Journal (DEJ) recently conducted research of more than 700 business and technology executives that identified their eight key goals for the next 12 months (Figure 1). One of the key findings of this research is that the correlation between the value proposition of IT performance solutions and the key business outcomes is not necessarily obvious to technology decision makers. The research also discovered a set of IT performance management capabilities that have a very strong impact on each of these 8 business goals and provides a framework for connecting the dots between effective IT performance practices and measurable business benefits.
This Analyst Note analyzes some of the key findings of this research and provides a preview to an upcoming research report on this topic.
Challenges
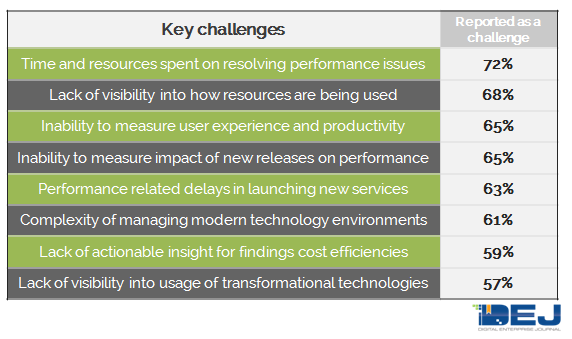
The executives that participated in DEJ’s research reported a number of challenges that are preventing them from achieving their top business goals for 2021 and some of them are shown in the table below.
These, and for the majority of others, pain points reported in this research are well aligned with the key value points of different flavors of IT performance management technologies. However, not all of the solutions for managing IT performance are created equal and, also, user organizations are taking different strategies and approaches for managing IT. This causes mixed results in using IT performance management solutions for addressing top business goals and leads to significant financial losses due to the cost of not acting, missed revenue opportunities and operational inefficiencies.
Leaving money on the table
The research shows that organizations are losing, on average $36.34 million per year due to the inability to proactively prevent IT performance issues. Some other areas of hard cost that can be eliminated by applying best practices and the right mix of management capabilities include infrastructure and tools cost, SLA penalties, resource utilization, etc. Moreover, areas such as declines in customer and employee engagement and satisfaction or user productivity can be categorized as a “soft” cost and are not even included in the total number for the business loss, as their impact can be hard to translate to monetary value (even though some organizations do have processes in place for calculating the financial impact of issues in these areas).
$36,340,000 – average annual loss due to the inability to proactively prevent IT performance issues
As organizations are reporting that being more efficient is their #1 business goal for 2021, it is almost absurd how much money they are losing due to inefficiencies in managing IT performance only. This comes as a result of two factors: 1) lack of visibility into these inefficiencies; 2) inability to measure their impact on key business goals. Addressing these issues effectively could strongly contribute to an organizations’ financial results and affect each of the key business outcomes they are looking to achieve.
Framework for measuring the business impact
The research shows that 74% of organizations are struggling to “connect the dots” between IT and business performance. Some of the key challenges they are experiencing in this process are issues with using technology as a competitive advantage, unclear impact on customer experience and the inability to quantify the impact on key business metrics.
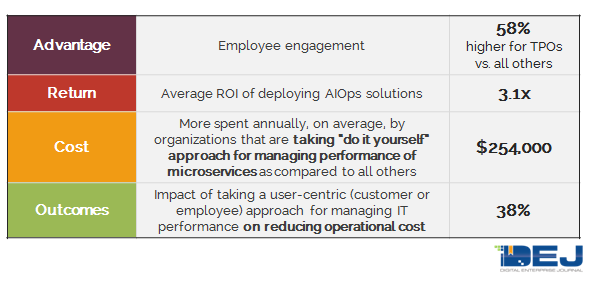
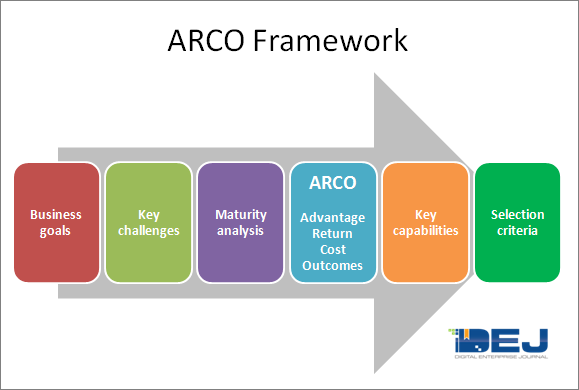
When identifying the total business impact of IT performance on key business goals, organizations should focus on 4 key areas: Competitive Advantage, Return on Investment, Cost (both cost of not acting and operational cost) and Business outcomes. These areas are a foundation of ARCO (Advantage, Return, Cost, Outcomes) framework that allows organizations to measure a total business impact of technology deployments and it serves as a key link between business goals and technology capabilities that they should be looking to deploy.
DEJ’s research shows that IT performance management technologies are having a strong impact on each of the 4 areas of ARCO framework, as shown in the table below.
Leveraging the ARCO model allows organizations to create an internal process around managing IT performance that addresses all the key areas that are causing inefficiencies, financial losses and declines in competitive position by:
- Selecting solutions and capabilities that are the best fit for their individual goals and requirements
- Fully understand the impact of technology deployments and being able to measure their true value
- Use IT as a source of competitive advantage and a driver for achieving business outcomes, as opposed to an enabler for “keeping the lights on”
- Understanding how their performance stacks up to the competition and customer requirements
- Ensuring that information used for creating technology strategies is actionable and relevant
Capabilities
When analyzing capabilities and performance of user organizations, DEJ leveraged Maturity Framework to identify: 1) class of top performing organizations (TPO) that qualified as the top 20% of the survey pool based on performance; 2) attributes and performance levels of TPOs.
DEJ’s 2020 study, “19 Key Areas Shaping IT Performance Markets in 2020” shows major changes in the selection process for IT performance with 58% of organizations selecting “situational alignment” (fit for a specific technology environment, pain points, use cases, etc.) as the top criteria. Therefore, even though capabilities deployed by TPOs have a strong impact on achieving top business goals, they should be evaluated in light of specific requirements that each organization has.
Summary
There is a strong correlation between key business pain points and leading capabilities for managing IT performance. This correlation is about to get even stronger as organizations are tasked with innovating faster, while having to address higher customer expectations for experience.


